期刊文章
过刊浏览
- Volumes 96-107 (2025)
-
Volumes 84-95 (2024)
-
Volume 95
Pages 1-392 (December 2024)
-
Volume 94
Pages 1-400 (November 2024)
-
Volume 93
Pages 1-376 (October 2024)
-
Volume 92
Pages 1-316 (September 2024)
-
Volume 91
Pages 1-378 (August 2024)
-
Volume 90
Pages 1-580 (July 2024)
-
Volume 89
Pages 1-278 (June 2024)
-
Volume 88
Pages 1-350 (May 2024)
-
Volume 87
Pages 1-338 (April 2024)
-
Volume 86
Pages 1-312 (March 2024)
-
Volume 85
Pages 1-334 (February 2024)
-
Volume 84
Pages 1-308 (January 2024)
-
Volume 95
-
Volumes 72-83 (2023)
-
Volume 83
Pages 1-258 (December 2023)
-
Volume 82
Pages 1-204 (November 2023)
-
Volume 81
Pages 1-188 (October 2023)
-
Volume 80
Pages 1-202 (September 2023)
-
Volume 79
Pages 1-172 (August 2023)
-
Volume 78
Pages 1-146 (July 2023)
-
Volume 77
Pages 1-152 (June 2023)
-
Volume 76
Pages 1-176 (May 2023)
-
Volume 75
Pages 1-228 (April 2023)
-
Volume 74
Pages 1-200 (March 2023)
-
Volume 73
Pages 1-138 (February 2023)
-
Volume 72
Pages 1-144 (January 2023)
-
Volume 83
-
Volumes 60-71 (2022)
-
Volume 71
Pages 1-108 (December 2022)
-
Volume 70
Pages 1-106 (November 2022)
-
Volume 69
Pages 1-122 (October 2022)
-
Volume 68
Pages 1-124 (September 2022)
-
Volume 67
Pages 1-102 (August 2022)
-
Volume 66
Pages 1-112 (July 2022)
-
Volume 65
Pages 1-138 (June 2022)
-
Volume 64
Pages 1-186 (May 2022)
-
Volume 63
Pages 1-124 (April 2022)
-
Volume 62
Pages 1-104 (March 2022)
-
Volume 61
Pages 1-120 (February 2022)
-
Volume 60
Pages 1-124 (January 2022)
-
Volume 71
- Volumes 54-59 (2021)
- Volumes 48-53 (2020)
- Volumes 42-47 (2019)
- Volumes 36-41 (2018)
- Volumes 30-35 (2017)
- Volumes 24-29 (2016)
- Volumes 18-23 (2015)
- Volumes 12-17 (2014)
- Volume 11 (2013)
- Volume 10 (2012)
- Volume 9 (2011)
- Volume 8 (2010)
- Volume 7 (2009)
- Volume 6 (2008)
- Volume 5 (2007)
- Volume 4 (2006)
- Volume 3 (2005)
- Volume 2 (2004)
- Volume 1 (2003)
Volume 100
Song, T., Fu, T., Gao, P., Zhao, T., & Yu, X. (2025). A recent emission inventory of S/IVOCs with high-resolution and evaluation in the Yangtze River Delta region of China. Particuology, 100, 186-195. https://doi.org/10.1016/j.partic.2025.03.010
A recent emission inventory of S/IVOCs with high-resolution and evaluation in the Yangtze River Delta region of China
Tongai Song, Tian Fu, Pengjie Gao, Tianliang Zhao, Xingna Yu *
Key Laboratory for Aerosol-Cloud-Precipitation of China Meteorological Administration, Nanjing University of Information Science and Technology, Nanjing, 210044, China
10.1016/j.partic.2025.03.010
Volume 100,
May 2025,
Pages 186-195
Received 30 September 2024, Revised 7 March 2025, Accepted 18 March 2025, Available online 25 March 2025, Version of Record 5 April 2025.
E-mail:
xnyu@nuist.edu.cn
Highlights
• The 3 km × 3 km gridded S/IVOCs emission inventory was developed based on county-level activity data over YRD region.
• Industrial process was the top contributor to S/IVOC emissions in the YRD region.
• High S/IVOC emissions were mainly concentrated in central YRD areas with developed industry and transportation.
Abstract
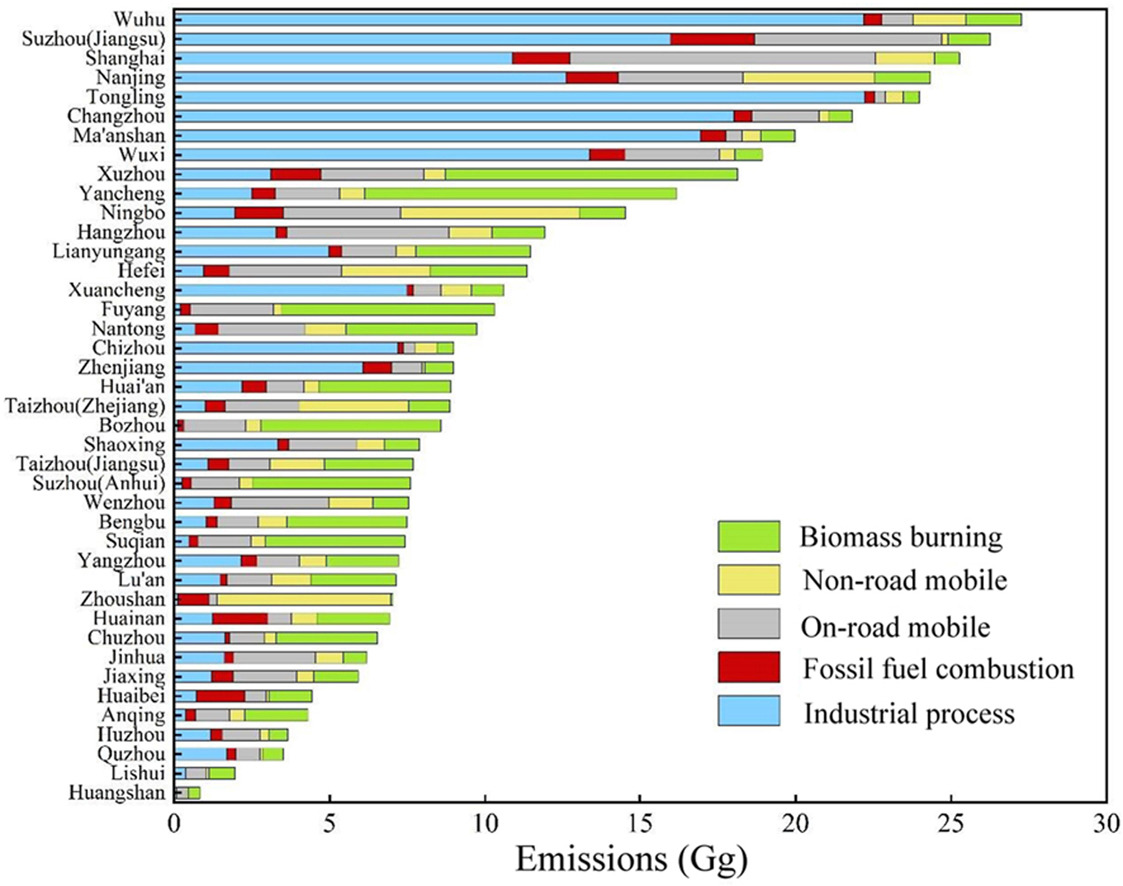
Semi-volatile and intermediate volatility organic compounds (S/IVOCs), as the key precursors, play an important role in forming secondary organic aerosol (SOA). However, the absence of S/IVOCs in the model has led to a significant gap between simulation and measurement of SOA. Although the emission inventory of S/IVOCs is prerequisite for improving the performance of SOA simulation and evaluating the roles of S/IVOCs in SOA production, a gridded anthropogenic emission inventory of S/IVOCs in the Yangtze River Delta (YRD) region is still limited. Therefore, a 2021-based high spatiotemporal resolution S/IVOCs emission inventory over the YRD region was developed in this study. The total emission of S/IVOCs for the YRD region was estimated to be 457.58 Gg. The industrial process was the major contributor to total emissions in Shanghai City, Anhui, and Jiangsu provinces with contributions of more than 40%, while on-road mobile sources contributed the most to S/IVOCs emissions in Zhejiang Province. High S/IVOCs emissions were mainly distributed in the central cities of the YRD with developed industry and transportation, such as Wuhu and Suzhou (Jiangsu), and in the northern cities with larger cultivated areas, such as Xuzhou and Yancheng. The uncertainty range of S/IVOCs emissions established in this study was −68%∼214%. Industrial process, industrial combustion, and on-road mobile were the sources with higher uncertainties of S/IVOCs emissions. A comprehensive S/IVOCs emission inventory established in this study can be used to estimate the emissions of S/IVOCs in 41 cities over the YRD region and can be applied to air quality models for a better understanding of the formation mechanism of SOA over the YRD region.
Graphical abstract
Keywords
Semi-volatile and intermediate volatility organic compounds; Yangtze River Delta; Uncertainty analysis; Emission inventory; Spatial and temporal allocation
文章导读