期刊文章
过刊浏览
- Volumes 96-107 (2025)
-
Volumes 84-95 (2024)
-
Volume 95
Pages 1-392 (December 2024)
-
Volume 94
Pages 1-400 (November 2024)
-
Volume 93
Pages 1-376 (October 2024)
-
Volume 92
Pages 1-316 (September 2024)
-
Volume 91
Pages 1-378 (August 2024)
-
Volume 90
Pages 1-580 (July 2024)
-
Volume 89
Pages 1-278 (June 2024)
-
Volume 88
Pages 1-350 (May 2024)
-
Volume 87
Pages 1-338 (April 2024)
-
Volume 86
Pages 1-312 (March 2024)
-
Volume 85
Pages 1-334 (February 2024)
-
Volume 84
Pages 1-308 (January 2024)
-
Volume 95
-
Volumes 72-83 (2023)
-
Volume 83
Pages 1-258 (December 2023)
-
Volume 82
Pages 1-204 (November 2023)
-
Volume 81
Pages 1-188 (October 2023)
-
Volume 80
Pages 1-202 (September 2023)
-
Volume 79
Pages 1-172 (August 2023)
-
Volume 78
Pages 1-146 (July 2023)
-
Volume 77
Pages 1-152 (June 2023)
-
Volume 76
Pages 1-176 (May 2023)
-
Volume 75
Pages 1-228 (April 2023)
-
Volume 74
Pages 1-200 (March 2023)
-
Volume 73
Pages 1-138 (February 2023)
-
Volume 72
Pages 1-144 (January 2023)
-
Volume 83
-
Volumes 60-71 (2022)
-
Volume 71
Pages 1-108 (December 2022)
-
Volume 70
Pages 1-106 (November 2022)
-
Volume 69
Pages 1-122 (October 2022)
-
Volume 68
Pages 1-124 (September 2022)
-
Volume 67
Pages 1-102 (August 2022)
-
Volume 66
Pages 1-112 (July 2022)
-
Volume 65
Pages 1-138 (June 2022)
-
Volume 64
Pages 1-186 (May 2022)
-
Volume 63
Pages 1-124 (April 2022)
-
Volume 62
Pages 1-104 (March 2022)
-
Volume 61
Pages 1-120 (February 2022)
-
Volume 60
Pages 1-124 (January 2022)
-
Volume 71
- Volumes 54-59 (2021)
- Volumes 48-53 (2020)
- Volumes 42-47 (2019)
- Volumes 36-41 (2018)
- Volumes 30-35 (2017)
- Volumes 24-29 (2016)
- Volumes 18-23 (2015)
- Volumes 12-17 (2014)
- Volume 11 (2013)
- Volume 10 (2012)
- Volume 9 (2011)
- Volume 8 (2010)
- Volume 7 (2009)
- Volume 6 (2008)
- Volume 5 (2007)
- Volume 4 (2006)
- Volume 3 (2005)
- Volume 2 (2004)
- Volume 1 (2003)
Volume 100
Mohamad Yusop, M. F., Rashid, M. M., Alam, M. M., & Ahmad, M. A. (2025). Copper metal-functionalized carbon from rattan waste via microwave pyrolysis for enhanced chloramphenicol removal: Optimization and F-test study. Particuology, 100, 196-213. https://doi.org/10.1016/j.partic.2025.03.011
Copper metal-functionalized carbon from rattan waste via microwave pyrolysis for enhanced chloramphenicol removal: Optimization and F-test study
Mohamad Firdaus Mohamad Yusop a, Md Mamoon Rashid b, Mohammad Mahtab Alam c, Mohd Azmier Ahmad a *
a School of Chemical Engineering, Engineering Campus, Universiti Sains Malaysia, 14300, Nibong Tebal, Penang, Malaysia
b Department of Chemical Engineering, College of Engineering, King Khalid University, Abha, 61411, Saudi Arabia
c Department of Basic Medical Sciences, College of Applied Medical Science, King Khalid University, Abha, 61421, Saudi Arabia
10.1016/j.partic.2025.03.011
Volume 100,
May 2025,
Pages 196-213
Received 17 December 2024, Revised 15 February 2025, Accepted 15 March 2025, Available online 26 March 2025, Version of Record 11 April 2025.
E-mail:
chazmier@usm.my
Highlights
• Optimized Cu2+-RMFC achieved CAP uptake of 76.15 mg/g and yield of 31.54 %.
• Modification with Cu2+ improved CAP uptake up to 50.06 % (30.40 % at pH 7).
• The Qm was 101.10 mg/g (linear method) and 108.00 mg/g (non-linear method).
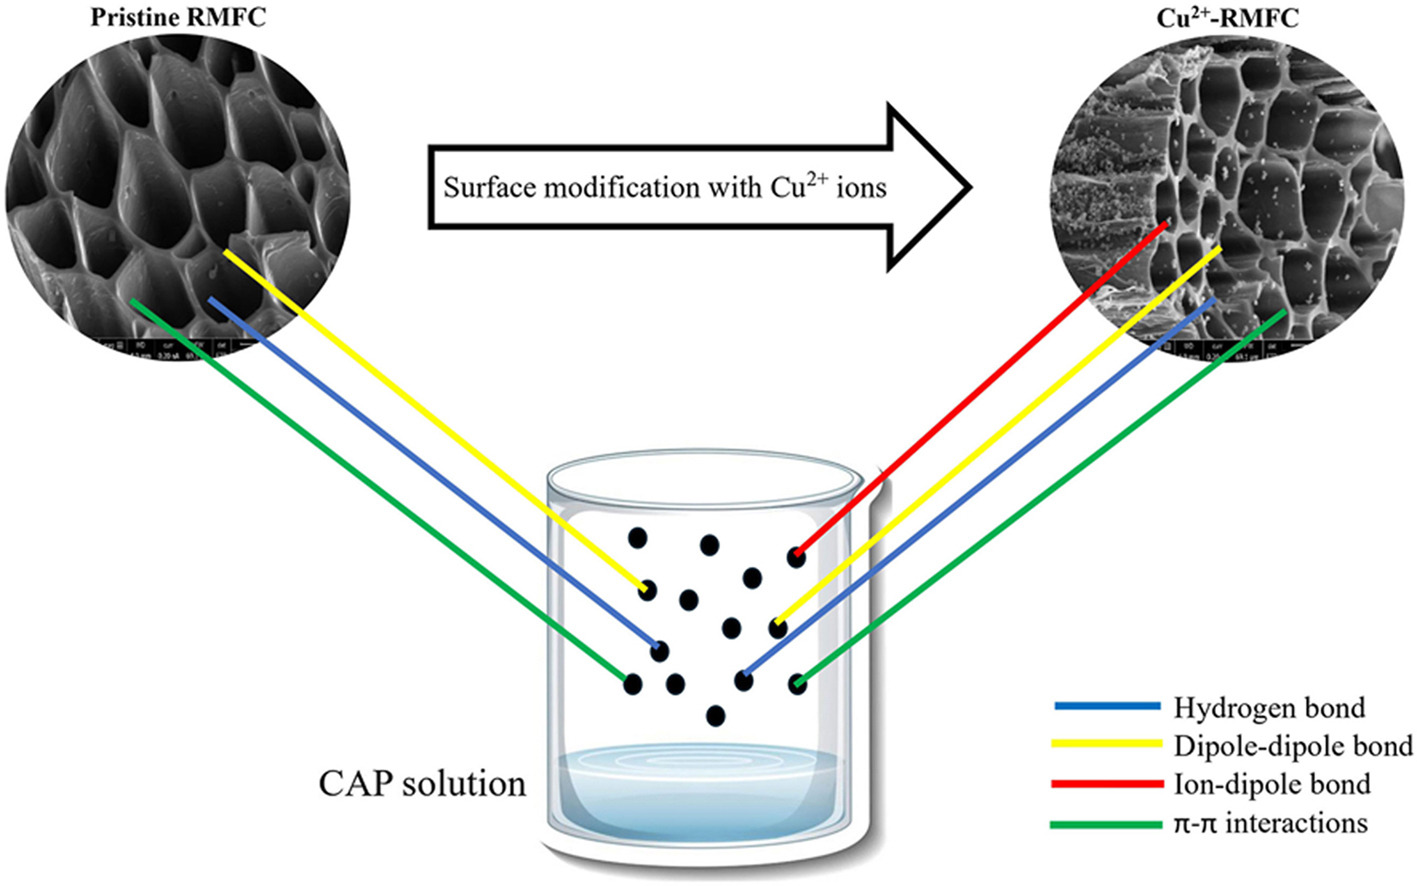
• Hydrogen, dipole-dipole, π-π, and ion-dipole boosted CAP affinity for Cu2+-RMFC.
• Null hypothesis was accepted for isotherm models and rejected for kinetic models.
Abstract
This study tackles the issue of chloramphenicol (CAP) in wastewater by exploring its removal using rattan waste-based metal functionalized carbon (RMFC). The study provides new insights into the adsorption mechanism by investigating the role of Cu2+ functionalization in enhancing CAP uptake through ion-dipole and π-π interactions. The RMFC surface was enriched with Cu2+ ions through modification with CuN2O6, resulting in the production of copper-enriched RMFC (Cu2+-RMFC). The conditions for preparing Cu2+-RMFC were optimized through response surface methodology (RSM). Following this, an F-test was conducted to evaluate the differences in variance distinguishing linear from non-linear approaches pertaining to isotherm together with kinetic models, with the null hypothesis proposing that these variances are the same. The adsorption capacities of CAP by pristine RMFC and Cu2+-RMFC were 53.69 mg/g and 77.14 mg/g, respectively, indicating a 30.40 % increase. Besides hydrogen bonds, dipole-dipole bonds, and π-π interactions, the enhanced CAP removal by Cu2+-RMFC was attributed to the ion-dipole interaction between Cu2+ ions and more electronegative oxygen (O) atoms in CAP molecules. The RSM identified the optimal conditions as 660 W, 8.07 min, and a metal loading ratio (MLR) of 0.47 g/g in relation to radiation power, duration of radiation, and MLR, correspondingly. These circumstances brought about predicted CAP uptake values of 76.15 mg/g (actual: 77.14 mg/g; error: 1.28 %) and a Cu2+-RMFC yield of 31.54 % (actual: 32.36 %; error: 2.53 %). The adsorption process was well represented by the non-linear Freundlich and non-linear pseudo-first-order (PFO) models. The adsorption capacity of the Langmuir monolayer (Qm) was 101.01 mg/g for the linear model and 108.00 mg/g for the non-linear model. The F-test results indicated that for all isotherm models studied, the F value was smaller than the F-critical value, leading to the acceptance of the null hypothesis. In contrast, the F values for all kinetic models exceeded the F-critical value, resulting in the refusal of the null hypothesis.
Graphical abstract
Keywords
Adsorption process; Metal functionalized carbon; Optimization; F-test; Surface modification
文章导读