- Volumes 96-107 (2025)
-
Volumes 84-95 (2024)
-
Volume 95
Pages 1-392 (December 2024)
-
Volume 94
Pages 1-400 (November 2024)
-
Volume 93
Pages 1-376 (October 2024)
-
Volume 92
Pages 1-316 (September 2024)
-
Volume 91
Pages 1-378 (August 2024)
-
Volume 90
Pages 1-580 (July 2024)
-
Volume 89
Pages 1-278 (June 2024)
-
Volume 88
Pages 1-350 (May 2024)
-
Volume 87
Pages 1-338 (April 2024)
-
Volume 86
Pages 1-312 (March 2024)
-
Volume 85
Pages 1-334 (February 2024)
-
Volume 84
Pages 1-308 (January 2024)
-
Volume 95
-
Volumes 72-83 (2023)
-
Volume 83
Pages 1-258 (December 2023)
-
Volume 82
Pages 1-204 (November 2023)
-
Volume 81
Pages 1-188 (October 2023)
-
Volume 80
Pages 1-202 (September 2023)
-
Volume 79
Pages 1-172 (August 2023)
-
Volume 78
Pages 1-146 (July 2023)
-
Volume 77
Pages 1-152 (June 2023)
-
Volume 76
Pages 1-176 (May 2023)
-
Volume 75
Pages 1-228 (April 2023)
-
Volume 74
Pages 1-200 (March 2023)
-
Volume 73
Pages 1-138 (February 2023)
-
Volume 72
Pages 1-144 (January 2023)
-
Volume 83
-
Volumes 60-71 (2022)
-
Volume 71
Pages 1-108 (December 2022)
-
Volume 70
Pages 1-106 (November 2022)
-
Volume 69
Pages 1-122 (October 2022)
-
Volume 68
Pages 1-124 (September 2022)
-
Volume 67
Pages 1-102 (August 2022)
-
Volume 66
Pages 1-112 (July 2022)
-
Volume 65
Pages 1-138 (June 2022)
-
Volume 64
Pages 1-186 (May 2022)
-
Volume 63
Pages 1-124 (April 2022)
-
Volume 62
Pages 1-104 (March 2022)
-
Volume 61
Pages 1-120 (February 2022)
-
Volume 60
Pages 1-124 (January 2022)
-
Volume 71
- Volumes 54-59 (2021)
- Volumes 48-53 (2020)
- Volumes 42-47 (2019)
- Volumes 36-41 (2018)
- Volumes 30-35 (2017)
- Volumes 24-29 (2016)
- Volumes 18-23 (2015)
- Volumes 12-17 (2014)
- Volume 11 (2013)
- Volume 10 (2012)
- Volume 9 (2011)
- Volume 8 (2010)
- Volume 7 (2009)
- Volume 6 (2008)
- Volume 5 (2007)
- Volume 4 (2006)
- Volume 3 (2005)
- Volume 2 (2004)
- Volume 1 (2003)
• Particle size distribution of submicron particulate matter under various conditions is simulated.
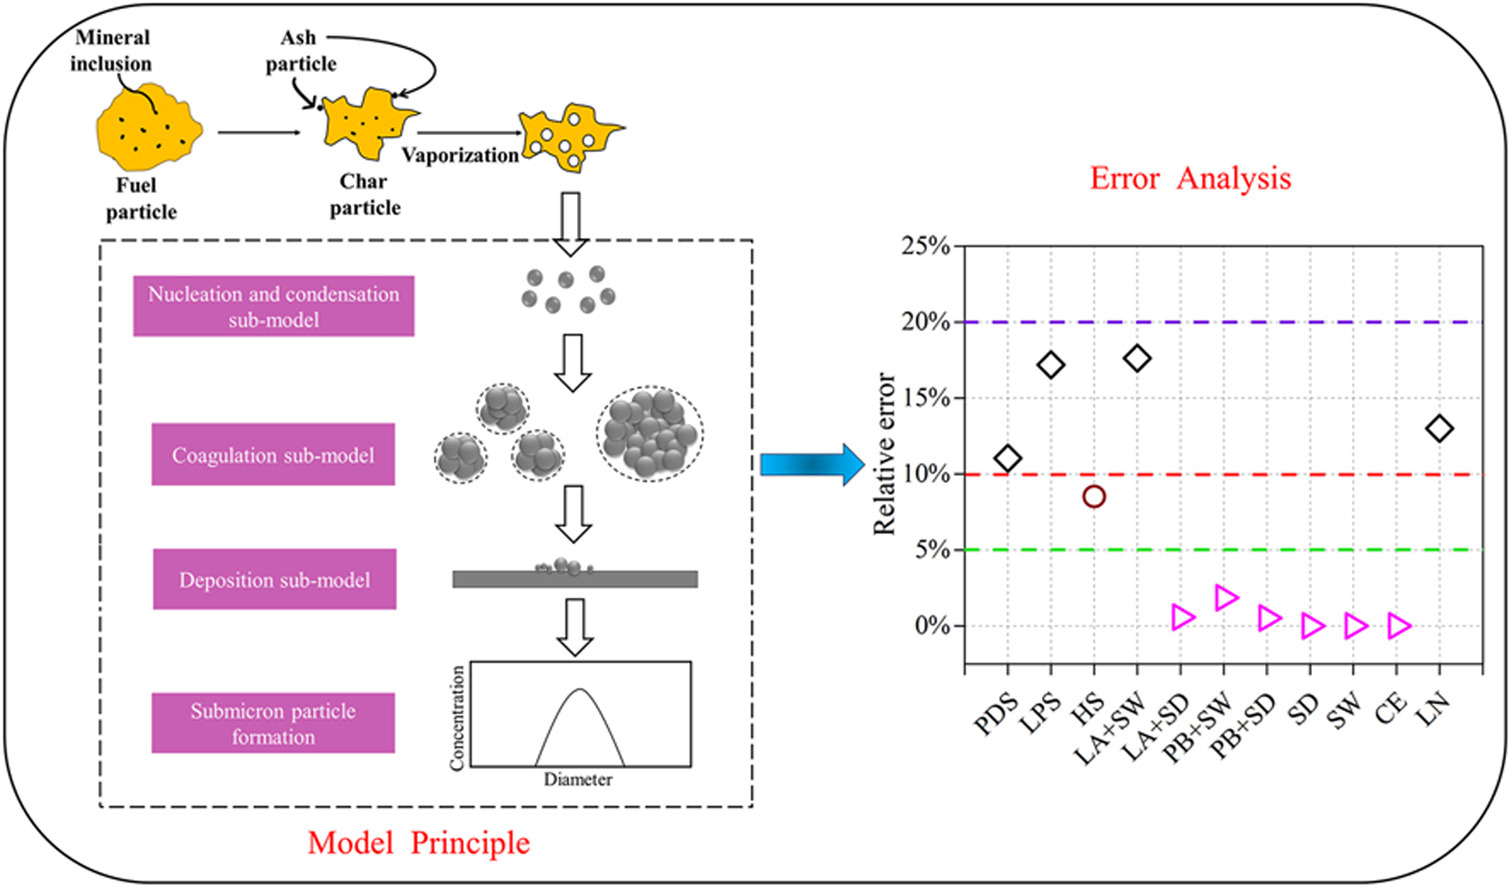
• Model fits experimental data well with relative error even below 10%.
• Verified model predicts particle size distribution of submicron particulate matter in some conditions.
• Effects on emission amount and particle size distribution of submicron particulate matter are explored.
Coal/biomass combustion is a major source of submicron particulate matter (sub-PM), with mineral substances in the fuels playing a key role in the formation and growth of these particles. In this study, the temporal evolution of sub-PM is predicted by simulating coal/biomass combustion under different temperature, atmosphere, species, particle size and density conditions by using nucleation, condensation, coagulation and deposition sub-models. Compared with experimental data, the results show that the amount of sub-PM generated from pulverized coal combustion increases with higher temperatures and oxygen concentrations, and lignin (LN) produces the highest emission of sub-PM among different biomass types. The peak particle size distribution (PSD) of sub-PM across different experimental conditions is mainly centered around 0.1–0.2 μm. The values of relative error are below 20% and even below 10%, indicating that the model is in good agreement with the experimental data. Subsequently, the effects of pulverized coal size and coal density on the PSD of sub-PM are predictively simulated by the verified model, the findings indicate that both of the peak PSD are among 0.08–0.23 μm, the emission amount of sub-PM negatively relate to coal size and coal density.

